Help Center
Statistics
Websiteworks.com offers a statistics feature that will allow you to see various reports on the site traffic through your site.
Access Statistics Feature
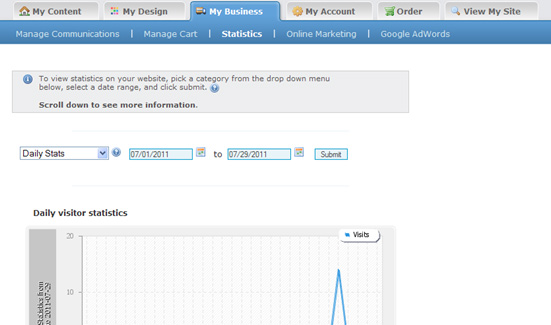
To access the feature, login to your Control Panel, click the My Business tab, and then click Statistics on the blue bar underneath. You will then see the first page of the statistics, as shown below. Note that by default, the dates are set from the first day of the current month, to the current day.
Statistics Date
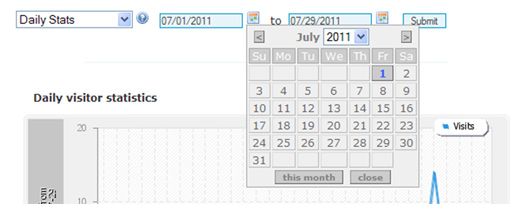
You can change the dates by either re-typing the dates in their boxes, or clicking the calendar icon next to each box and selecting the date on the calendar that opens. When you click Submit, the reports will update with the new date selections.
Statistics Types
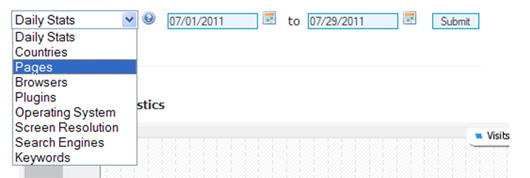
You can change the type of statistics you are looking at by clicking the left drop down menu, clicking your statistic selection, and then clicking Submit. Please see the below sections for detailed explanations of each of the statistic types and a list of terms used in site tracking and their definitions.
Terms
Session: an instance where one computer begins accessing any page on a specific website until the time the computer closes all web browsers and clears the cache.
Visitor: Any computer that is accessing your site.
Unique Visitor: one computer that is accessing a website and any page on the site during a single session.
Page: one section, or specific address on a domain, usually defined by the different names listed on the site"s menu.
Page Hit: a count of every time a specific page is opened on a site.
Plugin: an additional program that works in conjunction with a browser to add additional features and controls to websites.
Click-Through: a count of every time a link is from one site is clicked to reach another site page.
Daily Stats
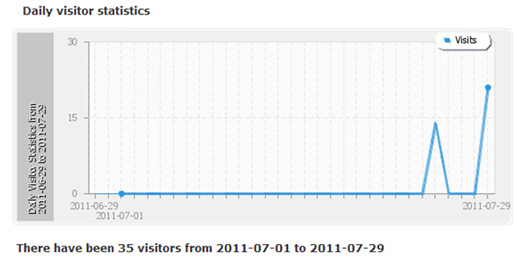
The Daily Stats page offers two line graphs for both Daily visitor statistics and Daily unique visitor statistics and a text line summary of each.
Daily visitor statistics tracks the total number of times each page on your site is opened by anyone on each day of the report. If someone is on the site and changes to different pages of your site, each page change will register another hit to the site.
The text line below the graph provides the total number of page hits for the given report period and the report period dates.
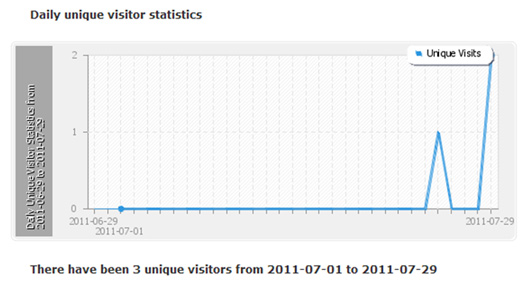
Daily unique visitor statistics
Tracks the total number of times a new visitor (one specific computer) comes to your site. If someone is on the site and changes to different pages of your site, this report will still only count them once.
It will also only count them once if they close and re-open your site. It will only count them as a new visitor if they delete their cache in the browser while not on the site and then return to the site.
The text line below the graph provides the total number of unique visitors per day for the given report period and the report period dates.
Countries
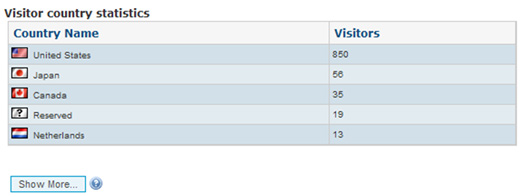
The Countries statistic page offers both a numerical spreadsheet and a pie chart of the visitor by country data.
The spreadsheet lists the five highest origins of visitors to your site and the total number of unique visitors from that country during the report period from highest down to lowest.
You can click the "Show More..." button to extend the spreadsheet to list all recorded visitor origins during the report period.
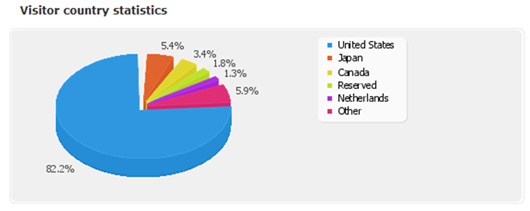
The pie chart breaks down the percentage of unique visitors that came from the top five countries, plus a single percentage for all other countries. The percentage is based on the total number of unique visitors during the report period.
Please note that the second highest country is listed in Orange on the pie chart and the Other countries are listed in Magenta.
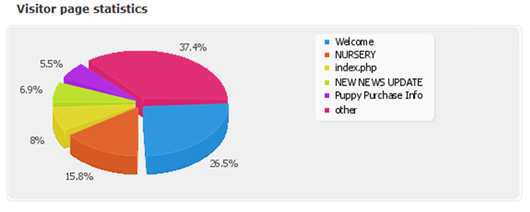
Pages
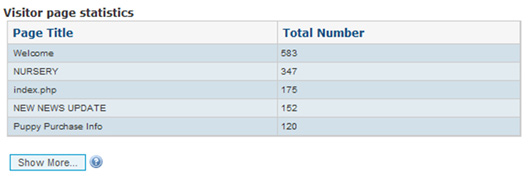
The Pages statistic page offers both a numerical spreadsheet and a pie chart of the visitor by page data.
The spreadsheet lists the five highest pages visited on your site and the total number of unique visitors per page during the report period from highest down to lowest.
You can click the "Show More..." button to extend the spreadsheet to list all pages that were visited during the report period.
Please note that the page index.php is the Flash Intro on your site.
The pie chart breaks down the percentage of unique visitors that came from the top five pages, plus a single percentage for all other pages. The percentage is based on the total number of unique visitors during the report period.
Please note that the second highest page is listed in Orange on the pie chart and the Other pages are listed in Magenta.
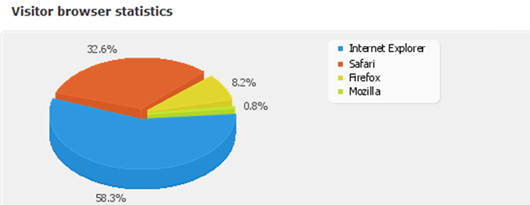
Browsers
The Browsers statistic page offers both a numerical spreadsheet and a pie chart of the visitor by browser data.
The spreadsheet lists the browsers used by visitors to your site and the total number of page hits with each browser during the report period from highest down to lowest.

The pie chart breaks down the percentage of each browser used per page hit based on the total number of page hits during the report period.
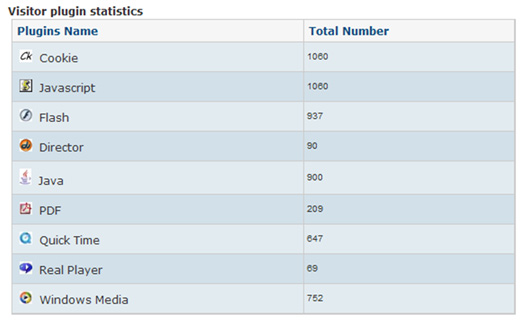
Plugins
The Plugins statistic page offers a numerical spreadsheet that lists the most common browser plugins that may be activated when visitors come to your site, and the number of times each plugin was activated during the report period. The plugins are not listed in a specific order.
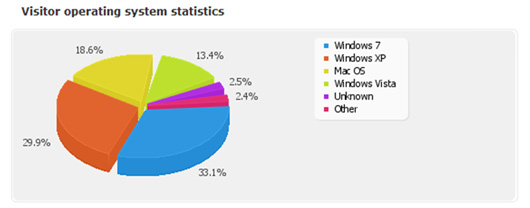
Operating Systems
The Operating Systems statistic page offers both a numerical spreadsheet and a pie chart of the visitor by system data.
The spreadsheet lists the five highest operating systems used by visitors to your site and the total number of page hits by visitors with that system during the report period from highest down to lowest.
You can click the "Show More..." button to extend the spreadsheet to list all recorded visitor"s operating systems during the report period.
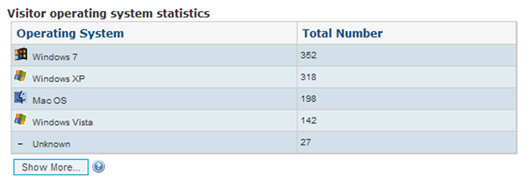
The pie chart breaks down the percentage of page hits that came from the top five operating systems, plus a single percentage for all other operating systems. The percentage is based on the total number of page hits during the report period.
Please note that the second highest operating system is listed in Orange on the pie chart and the Other operating systems are listed in Magenta.
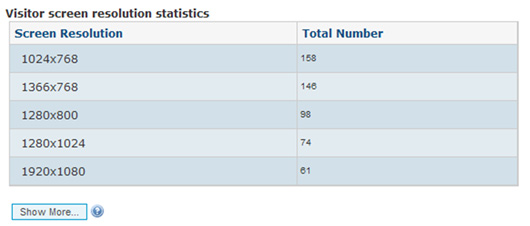
Screen Resolution
The Screen Resolution statistic page offers a numerical spreadsheet that lists the five highest screen resolutions used by visitors to your site and the total number of page hits with each resolution during the report period from highest down to lowest.
You can click the "Show More..." button to extend the spreadsheet to list all recorded visitor screen resolutions during the report period.
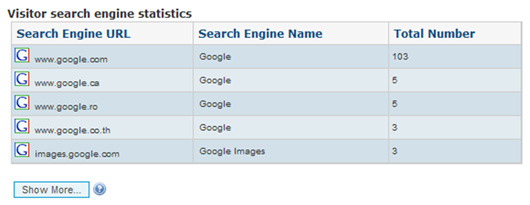
Search Engines
The Search Engine statistic page offers both a numerical spreadsheet and a pie chart of the search engine click-through data.
The spreadsheet lists the five highest origins of visitors to your site from each search engine used and the total number of click-throughs from each search engine during the report period from highest down to lowest. Each time a person clicks the link to visit your site on a search engine, it registers this search engine once.
You can click the "Show More..." button to extend the spreadsheet to list all recorded search engines during the report period.
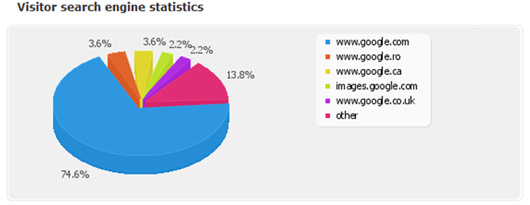
The pie chart breaks down the percentage of visitors that came from the top five search engines, plus a single percentage for all other engines. The percentage is based on the total number of click-throughs per search engine during the report period.
Please note that the second highest search engine is listed in Orange on the pie chart and the Other search engines are listed in Magenta.
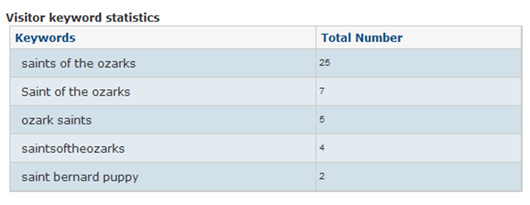
Keywords
The Keywords statistic page offers a numerical spreadsheet that lists the five highest keyword or keyword combinations entered into search engines that generated click-throughs to your site and the total number of click-throughs from those keywords during the report period from highest down to lowest.
You can click the "Show More..." button to extend the spreadsheet to list all recorded keywords that generated click-throughs during the report period.
 Tel.: toll free 1 (877) 769-3836 or (514) 282-7747